Benchmarking Working Capital is a widely used – and most often misused – tool in corporate finance. Companies lean on peer comparisons as if they provide clarity on performance, yet in practice they often obscure more than they reveal.
This article challenges the blind reliance on benchmarks, explains why operating working capital (OWC) is too important to be left to averages, and sets out three critical considerations for companies aiming to determine their own optimal working capital position – their Setpoint.
Benchmarking Working Capital - Table of Contents
Benchmarking Working Capital - Key Take Aways
Operating Working Capital is capital allocation, not a hygiene metric. It is one of the largest hidden investments a company makes, with direct impact on cash conversion cycles, cashflow, growth, and resilience.
There is no universal “optimal” level. OWC needs are company-specific, shaped by unique supply chain structures, customer terms, and strategic choices.
Benchmarks are mirrors, not answers. External comparisons can highlight trends and spark questions – but they rarely reveal a company’s true Setpoint.
Data averages are misleading. Most published corporate data or benchmarks are too high-level, too aggregated, and too disconnected from operational realities to be actionable.
The real value lies in triangulation. Used carefully, benchmarking can complement – not replace – the hard work of understanding your own transactional data, constraints, and strategy.
Operating Working Capital sits at the heart of a company’s cash conversion cycle – and by extension, its ability to fund growth, withstand shocks, and compete. Yet it is chronically under-managed compared to other capital allocations.
Unlike capex, which is scrutinized at board level, OWC often slips under the radar because its cost is diffuse, and ownership unclear. It hides in balance sheet averages: receivables that take too long to collect, inventories that grow unnoticed, and payables strategies applied inconsistently.
For many companies, OWC represents billions tied up in the system – yet accountability is fragmented and strategy absent. This while every additional day of excess working capital is cash that cannot be invested in innovation, digital transformation, or market expansion.
Treating OWC as an afterthought is not just financially inefficient; it is strategically negligent.
Is Benchmarking Working Capital Relevant?
The question is not whether benchmarking working capital is “good” or “bad.” It is whether you understand what it can and cannot do.
Yes – benchmarking can provide useful signals. It can reveal market trends, identify outliers, and spark valuable debates. But benchmarking is not a shortcut to discovering your company’s optimal operating working capital performance – its Setpoint.
Why?
OWC is context-specific. Supply chain design, customer mix, product portfolio, and geographic footprint create a structural baseline that few peers replicate.
Comparable peers are therefore rare. Even within the same industry, companies differ in business model, structure, risk appetite, and financing strategy.
Published data is too coarse. P&L and balance sheet disclosures lack the granularity to separate structure from performance.
In other words: benchmarking tells you if you’re in the same ballpark – but never where the goalposts are.
The Pitfalls of Benchmarking Working Capital
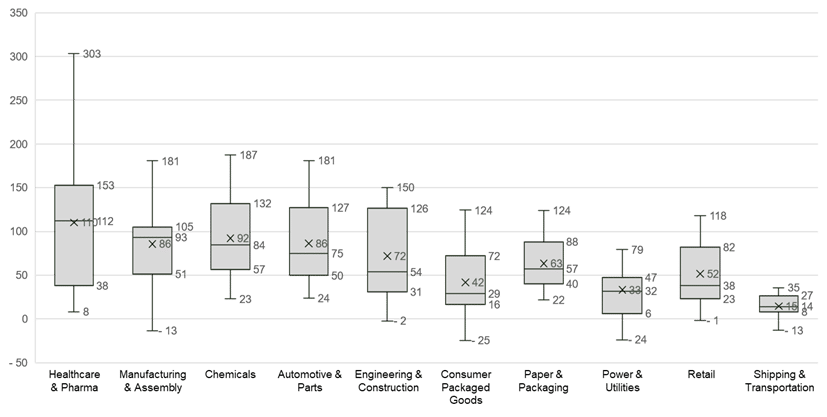
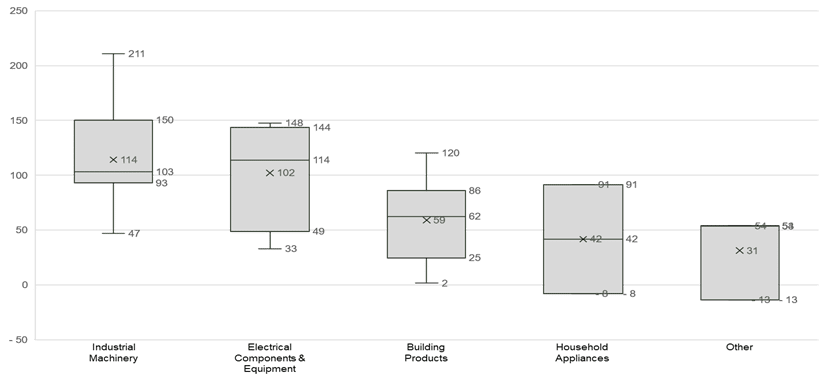
The challenges with benchmarking working capital become clear when we look at cash conversion cycles across industries. Figures 1 and 2 show the distribution of CCC for 160 Nordic companies with annual turnover above SEK 5bn.
Figure 1 shows variability at the industry-group level.
Figure 2 drills down into manufacturing sub-sectors.
What stands out is not just variation – it’s the scale of variation. Even within the same sector, companies differ by months, not days, in how long their cash is tied up in operations.
Figure 1. Cash Conversion Cycle by Industry group (days)
Figure 2. Cash Conversion Cycle by Industry subsector – Manufacturing and Assembly (days)
Source: Sample of 160 Nordic companies with annual turnover >5bn SEK, 2023 reported numbers
What this really tells us
These gaps are far too large to be explained by efficiency alone. They reflect structural realities, such as:
Market positioning (premium vs. mass-market).
Supplier terms (local vs. global contracts).
Customer relationships (enterprise vs. retail).
Strategic choices (lean vs. buffer-heavy models).
The danger of averages
This is why averages are a dangerous illusion. As statistician Sam Savage quipped: “The statistician drowned while crossing a river that was, on average, three feet deep.”
Setting targets based on industry averages is like wading into that river. It looks safe, but in practice it can pull you under. Companies that chase “median” benchmarks risk:
Stretching payables beyond what supplier relationships can bear.
Cutting inventory buffers that actually safeguard resilience.
Forcing receivables policies that alienate customers.
The result? Performance theatre – ratios that look good on paper, but underlying fragility that leaves the business exposed.
Common Mistakes in Benchmarking Working Capital
Benchmarking often drives companies into traps that look good on paper but erode performance in reality. Some of the most common mistakes include:
Stretching payables without strategy Extending supplier terms to “match industry averages” may boost reported cash flow, but it can also damage trust, trigger price increases, or push suppliers into distress.
Cutting inventory buffers too far Chasing leaner ratios without considering demand volatility leads to stock-outs, service failures, and lost revenue – costs that never show up in a simple CCC comparison.
Forcing receivables into a one-size-fits-all target Not all customers should be treated equally. Benchmarking can push companies to apply blunt credit terms that alienate key accounts or increase bad debt risk.
Mistaking structure for efficiency Two peers in the same industry may differ in payment cycles by months, not because one is “better managed,” but because of structural factors: market power, product mix, or geography. Comparing without context is misleading.
Optimizing for ratios, not resilience A company that cuts working capital to look efficient can end up brittle — unable to absorb shocks in supply or demand. Benchmarking encourages “performance theatre” rather than sustainable improvement.
From External League Tables to Internal, Real-Time Working Capital Benchmarking
Traditional benchmarking is static. It looks at annual reports, aggregates results, and tells you where you sit against an industry average. Useful at a glance – but limited.
With today’s digitalization and data availability, we no longer need to rely on league tables. Instead, companies can use internal, real-time benchmarks grounded in their own transactions.
What internal Working Capital Benchmarking means:
Internal benchmarking shifts the question. Instead of asking:
“How do we compare to peers?”
ask:
“How does this customer, SKU, or supplier perform against its setpoint — the optimal level, given its terms, planning parameters, and structural context?”
In practice, this means:
Move beyond aggregate P&L and balance sheet ratios – they flatten reality. Use transactional data as the source of truth.
Identify cohorts of comparable items, customers, or suppliers based on shared context and structure.
Determine each cohort’s setpoint – the OWC required to efficiently and effectively support operations.
Compare actual performance against the setpoint targets, and learn from your best-performing cohorts as benchmarks for what is achievable.
This shifts benchmarking from external and generic to internal and actionable.
The Benchmarking Trap vs. the Setpoint Approach
The Benchmarking Working Capital Trap
External, aggregate-driven benchmarking relies on CCC, DSO, DIO, and DPO ratios that flatten reality into averages. It is:
Externally oriented – assumes peers are relevant, even when structural differences make comparisons meaningless.
An illusion of control – industry medians feel like targets but conceal volatility and root causes.
Reactive – prompts catch-up behaviour (stretching payables, cutting buffers) that may destroy long-term value.
Result – performance theatre: short-term optics, long-term fragility.
The Setpoint Approach (via transactional lens)
Transactional wisdom starts with invoices, SKUs, contracts, and suppliers – the real levers of change. It is:
Internally anchored – defines performance relative to your own supply chain, customers, and constraints.
Context-aware – separates what is structural (industry-imposed) from what is controllable (management-driven).
Proactive – sets OWC levels that balance cash release, resilience, and growth potential.
Result – sustainable improvement: cash freed without eroding supplier trust, service levels, or resilience.
Figure 3: Working Capital Benchmarking Framework
Why Transactional Wisdom Matters
Aggregates tell you what happened. Transactions reveal why.
Benchmarking and ratio analysis are essential – they show whether your company performs above or below peers. But they are descriptive, not diagnostic. Averages compress complexity into a single number, hiding the variance and behavioral patterns that drive your working capital outcomes.
Transactional analysis – line-by-line data from invoices, purchase orders, goods receipts, and payments – exposes these dynamics. It reveals distributions, outliers, and root causes that averages can never show.
For example:
Receivables (DSO): A DSO of 45 days may appear stable. But when you segment transactions by customer, product, or region, you often find a heavy-tailed distribution: 20% of customers account for 80% of overdue balances. Cluster analysis might show that delays correlate with specific contract structures, credit terms, or dispute codes. Targeting those structural issues can reduce DSO by double digits – something no aggregate benchmark could pinpoint.
Inventory (DIO): “Inventory days” suggest a simple measure of efficiency, but transactional SKU-level data tells a different story. Pareto analysis may reveal that 15% of items drive 70% of inventory value, while slow-moving SKUs inflate the overall ratio. Statistical dispersion metrics (like standard deviation of days-on-hand across SKUs or locations) often highlight planning bias or parameter drift – evidence that safety stock settings or reorder points are misaligned with current demand variability.
Payables (DPO): An average DPO of 55 days looks strong – until transaction-level data shows wide dispersion. Some suppliers are paid on day 30, others on day 90. A regression of payment days against supplier criticality or spend volume might show inconsistent term compliance or missed discount opportunities. Transactional granularity helps identify which suppliers could tolerate extended terms – and which are being pushed beyond acceptable limits, creating supply risk.
Benchmarks spark hypotheses. Transactions test them.
Aggregates show the outcome; transactions show the mechanism.
By combining benchmarking with transactional analytics – variance, segmentation, and root-cause linkage – working capital management becomes a data-driven control system, not just a reporting metric.
Where is Benchmarking Working Capital Headed?
With transactional data, AI, and real-time visibility, external benchmarking may become largely obsolete. The future lies in internal, dynamic setpoints:
Cadence: from quarterly ratios to continuous visibility.
Targets: from industry medians to setpoint targets per cohort.
Decisions: from blunt cost-cutting to precise, context-aware improvements.
External benchmarks will remain useful as context and conversation starters. But internal benchmarks define the answer – by comparing cohorts against their own setpoint and learning from the best performers.
Figure 4: Working Capital Benchmarking Maturity Curve
What Should You Benchmark?
If you still choose to benchmark externally, treat it as hygiene, not a compass. Core metrics such as:
Working Capital Ratio – current assets vs. current liabilities.
Net OWC as % of Sales – working capital required to support each unit of revenue.
DSO, DIO, DPO – the building blocks of CCC.
Cash Conversion Cycle (CCC) – the net time to turn resources into cash.
These metrics are useful – but they are the minimum. On their own, they cannot show whether your company is structurally efficient, strategically aligned, or resilient.
For that, you need to go deeper:
Volatility of OWC across cycles. Stability often reveals more about discipline than averages.
Performance vs. Structure. Separate what is dictated by your industry model from what is within your control.
Three Considerations When Determining Your OWC Setpoint
There are no shortcuts. Determining your optimal working capital level requires hard analysis, discipline, and cross-functional alignment. Companies that succeed typically embrace three principles:
Data discipline beats averages. Transactional data is more truthful than league tables. Accurate master data, clean planning parameters, and process visibility are prerequisites. Without them, benchmarking is guesswork.
Internal mastery before external envy. Benchmarking only makes sense once you’ve mapped your own processes and constraints. Many companies have years of untapped internal improvement before external comparisons add value.
End-to-end alignment beats local optimization. OWC is an enterprise game. Sales, procurement, finance, and operations must align to a shared setpoint. Without it, silos will “optimize” locally while destroying value globally.
Closing Thought on Benchmarking Working Capital
Working Capital Benchmarking is seductive because it offers easy numbers and comforting comparisons.
But the hard truth is that your optimal OWC setpoint cannot be borrowed from peers. It must be discovered, defined, and defended within the reality of your own supply chain and strategy.
Use benchmarks as mirrors to spark the right questions – but don’t mistake them for answers. The only benchmark that matters is the one you set for yourself.
Ready to take the next step?
Turn theory into practice and boost your career with accredited training. Become a Certified Working Capital Expert by enrolling in our flagship course: Managing Working Capital.
AI is transforming credit analysis - not by replacing analysts, but by removing the manual work that slows decisions and traps capital in receivables. It’s not credit analysis that harms
Supply chain bias is the hidden force that makes working capital improvements stall. When functions optimize for themselves, the business as a whole loses. This article explores how bias creeps
Working capital is no longer financial housekeeping — it’s a battleground for growth and resilience. At the center lies the Operating Working Capital Setpoint: the sweet spot where efficiency and