How to Calculate the Cash Conversion Cycle - and What the Number Actually Means

How to Calculate the Cash Conversion Cycle – and What the Number Actually Means

Working Capital Hub - Post Image - F

Table of Contents

Working Capital Hub - Post Image - B

Introduction

At its core, the Cash Conversion Cycle (CCC) measures how long cash is tied up in a company’s day-to-day operations.

It tracks the journey of cash as it moves through the business – from the moment a company commits cash to buying or producing goods and services, to the moment that cash is recovered through customer payments.

In simple terms, the CCC shows how efficiently a business turns its operating activity into cash.

This matters because profit and cash are not the same thing. A company can be profitable on paper but still have significant amounts of cash locked up in inventory sitting in warehouses, receivables waiting to be paid, or inefficient supplier payment flows across the supply chain.

The Role of the Cash Conversion Cycle

The CCC helps make that hidden capital visible.

The metric captures three core stages of the operating cycle:

  • How long inventory is held before it is sold
  • How long it takes to collect cash after a sale is made
  • How long the company takes to pay its suppliers

These three stages are critical because they represent the main places where operating cash becomes tied up – or released.

To measure this, the Cash Conversion Cycle brings together three underlying operating working capital metrics:

  • Days Inventory Outstanding (DIO) – how long inventory remains in the business before being sold
  • Days Sales Outstanding (DSO) – how long it takes to collect payment from customers
  • Days Payable Outstanding (DPO) – how long the company takes to pay suppliers

Taken together, these metrics provide a time-based view of working capital efficiency.

They show not just how much working capital is invested, but how long that cash remains trapped in the operating cycle before it returns to the business.

That is what makes the CCC so useful: it connects operational decisions in supply chain, sales, and procurement directly to liquidity, cash flow, and financial flexibility.

Let us now look at how to calculate the cash conversion cycle.

The Cash Conversion Cycle shows how efficiently a business turns operations into cash.

Working Capital Hub - Insights - Cash Conversion Cycle

The Standard Formula to Calculate the Cash Conversion Cycle (and what it assumes)

The Cash Conversion Cycle is calculated as:

CCC = DIO + DSO – DPO

Where:

At face value, the formula is simple:

How long cash is tied up in inventory and receivables, minus the time you are able to delay paying suppliers.

Each component represents a different stage where cash is either committed, trapped, or released.

And importantly, the formula assumes that these stages follow a clean, sequential flow. In reality, they often overlap, vary by product, and behave differently across customers and suppliers.

That is why understanding the logic behind the formula matters just as much as calculating it.

Want a sharper view of cash and performance? 

Explore the Hub’s complete guide to the Cash Conversion Cycle.

The logic behind the Cash Conversion Cycle formula (what it’s really measuring)

Rather than thinking of CCC as a static KPI, it is more useful to see it as a timeline of cash moving through the operating cycle.

Working capital Hub - Cash Conversion Cycle and Time - Calculate the Cash Conversion Cycle

Each component reflects a different operational reality:

DIO: How long cash is committed before a sale happens

DIO measures the time between investing cash in inventory and converting that inventory into revenue.

This is the first point where cash becomes tied up in the process.

  • High DIO means that cash sits in stock longer: this in turn could indicate slow-moving inventory, poor forecasting, or deliberate buffering against uncertainty
  • Low DIO means faster inventory turnover: this often reflects lean operations, but could also mean the company is carrying too little inventory, increasing the risk of stockouts or lost sales
  • Insight: DIO is not just about efficiency – it should reflect your supply chain strategy and risk tolerance.

DSO: How long cash is tied up after the sale

Once a sale is made, cash is still not in the bank. DSO measures the time between invoicing and actually receiving payment.

  • High DSO means cash is locked in receivables: this could reflect weak collections, frequent disputes and claims, or intentional credit extension to drive sales.
  • Low DSO means faster cash collection: this indicates short applied payment terms, strong collection discipline, but may constrain commercial flexibility or competitiveness.
  • Insight: DSO is where finance meets commercial strategy – it reflects how you balance growth, customer relationships, and cash.

DPO: How long you can defer cash outflows

DPO measures how long a company takes to pay suppliers, effectively capturing how much of the operating cycle is financed externally.

  • High DPO – cash is retained longer: This may reflect strong negotiation power or structured supplier financing but could also mean supplier payments are structurally delayed to temporarily improve cashflow.
  • Low DPO – quicker payments: this could signal missed financing opportunities – or a deliberate choice to support suppliers through short payment terms or early payments.
  • Insight: DPO is not just about delaying payments – it reflects your position in the value chain and supplier strategy.

Putting it together: Cash Conversion Cycle as a cash timeline

When combined, these three elements answer a simple but powerful question: How many days does cash remain tied up in the operating cycle before it returns to the business?

This can also be understood as the company’s funding gap – the period during which the business must finance its own operating activity.

In practical terms, the sequence looks like this:

  • Cash is committed to inventory
  • Then remains tied up in receivables
  • While supplier payables helps offset part of that funding need

That is why:

CCC = DIO + DSO – DPO

Or put differently:

CCC = the net number of days cash is out of the business

Example: How to Calculate the Cash Conversion Cycle

Below is a simplified example for a company with the following annual figures:

Item Value ($'000)
Revenue 100,000
Cost of Goods Sold 60,000
Inventory 12,000
Accounts Receivable 15,000
Accounts Payable 10,000

Step 1: Calculate each component

Metric Formula Calculation Result
DIO Inventory / COGS * 365 12,000 / 60,000 * 365 73 days
DSO Accounts Receivable / Revenue * 365 15,000 / 100,000 * 365 55 days
DPO Accounts Payable / COGS * 365 10,000 / 60, 000 * 365 61 days

Step 2: Calculate CCC

Metric Formula Calculation Result
CCC DIO + DSO - DPO 73 + 55 - 61 67 days

What this means

A Cash Conversion Cycle of 67 days means that, on average, cash is tied up in the operating cycle for 67 days between paying suppliers and collecting cash from customers.

In practical terms:

  • The business holds inventory for around 73 days
  • Then waits another 55 days on average to collect from customers
  • But offsets part of that funding need by taking around 61 days to pay suppliers

So the company must effectively finance 67 days of operations with its own capital or external funding.

What determines whether a CCC is “good”?

Is 67 days good or bad? On its own, the number doesn’t tell you much.

A CCC of 67 days could be:

  • Excellent in one industry
  • Concerning in another
  • Or entirely appropriate given the company’s operating model

This is because the Cash Conversion Cycle is not just a measure of efficiency – it reflects the underlying structure and constraints of the business.

Cash Conversion Cycle - Supply Chain Context

To interpret CCC properly, you need to consider the operating context.

Example: Supply chain structure

  • Does the company source materials locally or globally?
  • Long inbound lead times typically require higher inventory, leading to higher DIO requirements.

Example: Production and operational complexity

  • Make-to-order vs. make-to-stock
  • Customization, batch sizes, and production constraints all influence stock keeping requirements.

Example: Customer dynamics

  • What payment terms are standard in the market and is the company in a position to negotiate favourable payment terms with its customers.
  • Does the company extend credit to win or retain business?

Example: Supplier relationships and bargaining power

  • Can the company negotiate longer payment terms or does it need to pay early to secure supply?

Example: Industry norms

  • Retail vs. manufacturing vs. services behave very differently
  • Comparing CCC across industries can be misleading

This is where CCC becomes more strategic.

Every business operates around a natural working capital setpoint – a level of inventory, receivables, and payables that reflects:

  • Lead times
  • Capacity constraints
  • Operational complexity
  • Demand predictability

These factors define what is structurally required to run the business. A “good” CCC is therefore not necessarily the lowest possible number – it is the right number given the current operating model.

Trying to push CCC below that setpoint can create unintended consequences:

  • Cutting inventory too far leads to stockouts and lost sales
  • Tightening receivables aggressively can lead to damaged customer relationships or lost sales
  • Extending payables excessively create supplier risk or cost increases

To explore this further, see what a good Cash Conversion Cycle looks like – and why shorter isn’t always better.

Instead of asking: “Is 67 days good?” ask: “Is 67 days consistent with how this business needs to operate – and where are the opportunities to improve without breaking the model?”

Working Capital Hub - Post Image - H

Why Every Day Counts

Even though the Cash Conversion Cycle is measured in days, its real impact can be translated into cash.

This is what makes the metric so useful in practice: it helps illustrate why even a seemingly small improvement can be meaningful.

Every one-day reduction in CCC releases the cash equivalent of one day of operating activity.

As a rough rule of thumb:

Cash value of 1 CCC day ≈ Annual revenue ÷ 365

In our simplified example above, that means:

100,000 ÷ 365 ≈ 274

So a one-day improvement in the Cash Conversion Cycle would release approximately $274,000 of cash.

A 10-day improvement would therefore release approximately $2,740,000.

This helps put the metric into practical terms.

Even a modest reduction in inventory days, receivables days, or an improvement in supplier payment terms can release real liquidity from the business.

That cash can then be used for:

  • growth investments
  • debt reduction
  • resilience and liquidity buffer
  • reducing reliance on external financing

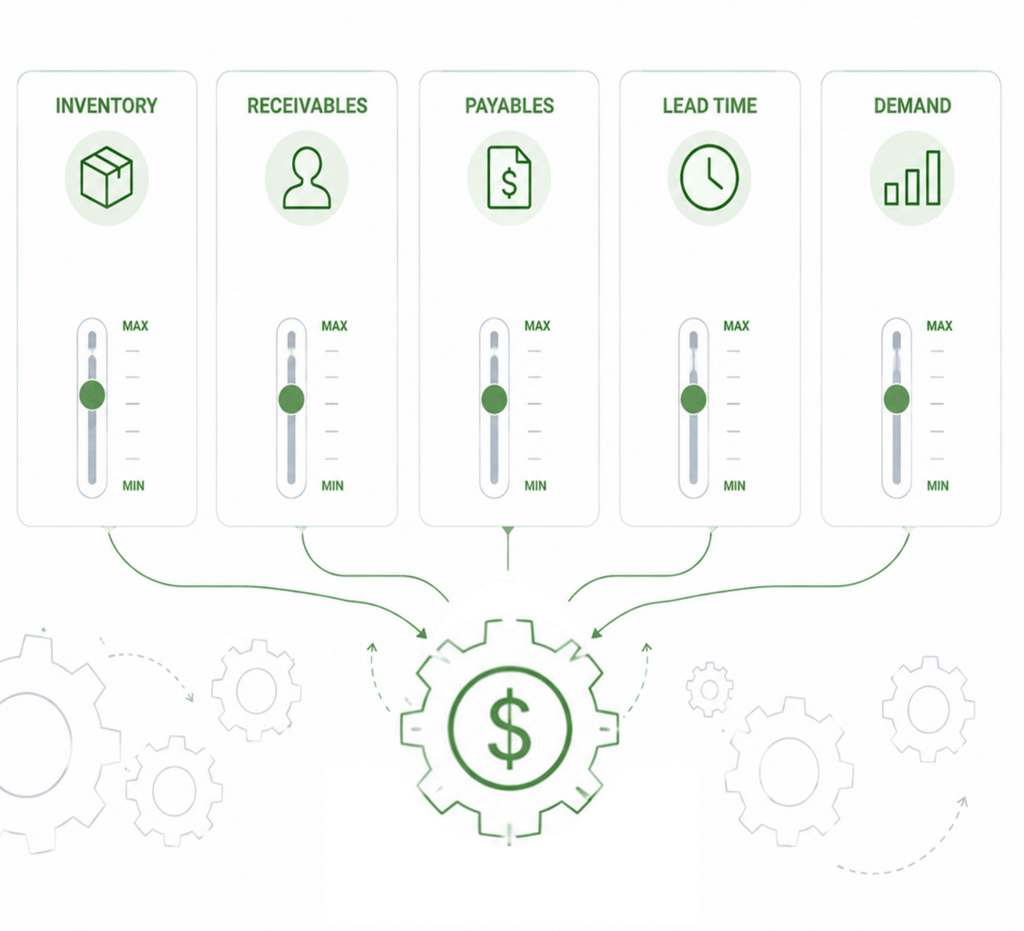
However, not every day in the Cash Conversion Cycle should automatically be removed.

Some working capital is structurally required to support a company’s operating model, service levels and commercial position.

The most valuable CCC improvements are therefore not the fastest ones, but the ones that are sustainable, structurally sound, and aligned with the business’s working capital setpoint.

If You Found This Insightful, Explore more Hub Point of Views here

How to Calculate the Cash Conversion Cycle - and What the Number Actually Means

How to Calculate the Cash Conversion Cycle – and What the Number Actually Means

The Cash Conversion Cycle (CCC) is one of the most widely used working capital metrics - but what does it actually measure? This article explains how to calculate the cash
Why a Shorter Cash Conversion Cycle Isnt Always Better

What Is a Good Cash Conversion Cycle? Why Shorter Isn’t Always Better

What is a good Cash Conversion Cycle? Most companies treat the Cash Conversion Cycle (CCC) as a race to the bottom - the shorter, the better. But in reality, a
Conquer the Bullwhip Effect - 3 Essential Strategies to Protect Inventory Working Capital and Cash Flow

Conquer the Bullwhip Effect: 3 Essential Strategies to Protect Inventory, Working Capital, and Cash Flow

Distorted demand signals don’t just disrupt operations - they quietly destroy working capital. Small shifts in consumer behaviour can cascade into bloated inventory, volatile capacity, and contaminated demand data across

Want to become an accredited Setpoint Expert?

Take the course Masterclass – Managing Working Capital at the Hub’s learning center My Academy Hub and gain the skills to turn liquidity into growth and resilience.

Author

author avatar
Alexander Flach
Index