

Most articles about safety stock focus on formulas.
While formulas are important, they are only one part of the decision.
In practice, effective safety stock management requires understanding what drives inventory levels, how service targets affect stock requirements, when different calculation methods should be used, and why calculated values often need adjustment based on business risk.
This article explains the most common approaches to calculating safety stock, the key drivers behind inventory buffers, and how leading organizations use segmentation and ongoing review to keep safety stock aligned with changing business conditions.

Want to improve inventory performance beyond safety stock?
Explore the Hub’s comprehensive guide: Inventory – Complete Guide, Metrics & Best Practices
At its core, safety stock is inventory held to protect against uncertainty.
Demand is rarely exactly as forecasted. Suppliers do not always deliver on time, and production or transportation disruptions occur more often than planners would like.
Safety stock acts as a buffer between these uncertainties and the customer, protecting service while replenishment is underway.

The challenge is not only about deciding whether safety stock is needed. The challenge is determining how much.
Every organization is therefore trying to find the same balance: enough inventory to protect service, but no more than necessary. The level of safety stock therefore reflects a company’s risk posture – how much variability it is willing to absorb before service is affected.
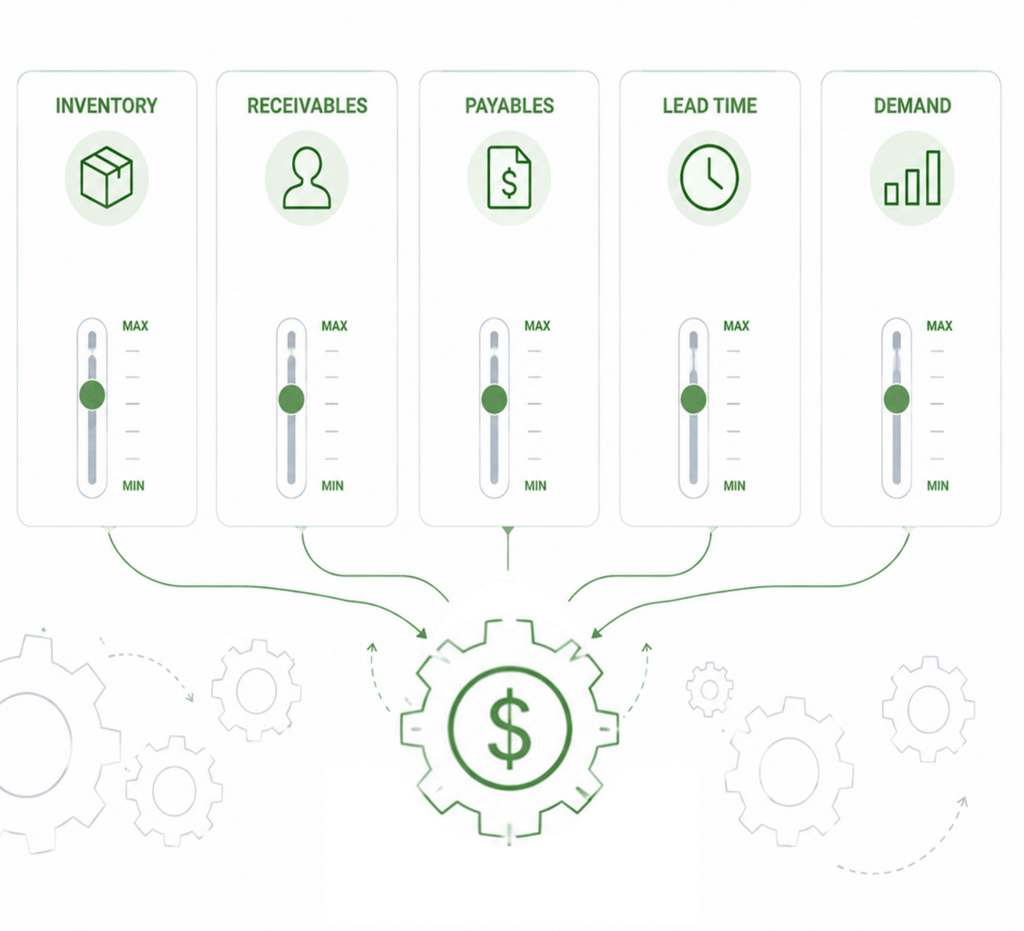
Safety stock is ultimately a operating working capital decision.
Every additional unit held in inventory improves protection against uncertainty but also ties up cash that could be invested elsewhere in the business. The challenge is finding the right balance between inventory investment and business performance.
| Safety Stock Too low | Safety Stock Too High |
|---|---|
| Increased service risk | Reduced capital efficiency |
| Stock-outs and lost sales | Inventory concentrated in the wrong products |
| Operational disruption | Hidden process inefficiencies |
| Expediting and firefighting | Lower inventory turns |
| Customer dissatisfaction | Reduced focus on root-cause improvement |
Many organizations naturally focus on the risks associated with too little inventory:
Inventory investment is often constrained by working capital targets, inventory budgets, or physical storage capacity. Excessive safety stock in one part of the portfolio reduces the organization’s ability to invest in inventory elsewhere.
Perhaps more importantly, excessive inventory often masks underlying problems such as poor forecast accuracy, long lead times, large batch sizes, or weak planning discipline. As long as inventory remains available, the root causes may never be addressed.
This means that excessive safety stock can indirectly reduce service performance by preventing investment in the right inventory while simultaneously hiding the operational issues that created the problem in the first place.
For a broader view of the operational and financial levers that influence working capital, see our guide: Working Capital Drivers – Key Drivers and Improvement Levers.

Although companies use different methods to calculate safety stock, most approaches are ultimately trying to manage the same three drivers: demand variability, lead time, and service level.

The first two are largely operational realities. Service level is different. It is a management decision that determines how much inventory the business is willing to invest in protecting availability.
| Driver | Impact on Safety Stock | Can you influence it? |
|---|---|---|
| Demand Variability | Higher variability increases required safety stock | Limited |
| Lead Time | Longer lead times increase required safety stock | Often yes |
| Service level | Higher service targets increase required safety stock | Fully |
Demand variability describes how much actual demand deviates from average demand. The more volatile demand is, the more uncertainty the replenishment system must absorb, and the larger the safety stock requirement becomes.
While companies can improve forecasting, segment products, or smooth demand over time, demand variability is often something planners must largely live with in the short term.
Lead time determines how far into the future inventory decisions must be made. The longer the lead time, the greater the uncertainty that must be covered.
Unlike demand variability, lead time can often be influenced through supplier improvements, replenishment frequency, batch size reductions, and process improvements. Reducing lead time is frequently one of the most effective ways to reduce safety stock requirements.
Unlike demand variability and lead time, service level is not an external reality. It is a management decision.
The service level determines how much inventory the business is willing to invest in protecting product availability.
In most statistical safety stock calculations, the service level is converted into a multiplier – commonly referred to as a Z-factor or Z-score.
The higher the desired service level, the larger this multiplier becomes and the more safety stock the system recommends holding.

There is no single universally accepted method for determining safety stock.
Different companies use different approaches depending on the quality of available data, the complexity of their operations, and the level of precision required.
Some methods rely heavily on historical demand and statistical analysis. Others use simpler coverage rules or adjust inventory levels based on business risk and product criticality.
Two common approaches are:
| Approach | How It Works | Best Suited For |
|---|---|---|
| Statistical Safety Stock | Uses demand variability, lead time, and service level to calculate a buffer | High-volume products, stable demand patterns, and organizations with reliable data. |
| Coverage-Based Safety Stock | Defines safety stock as a period of demand coverage (e.g. weeks of demand or replenishment cycles) | Simpler environments, spare parts, new products, and situations with limited historical data |
The statistical approach is the most widely used method for calculating safety stock and is commonly embedded within ERP and planning systems.
Its objective is straightforward: estimate how much inventory is required to protect service against normal fluctuations in demand and supply.
Rather than relying on rules of thumb, the method uses historical data to quantify uncertainty and translate it into an inventory buffer.

A commonly used version of the formula is:
Safety Stock = Z × σD × √LT
Where:
| Variable | Meaning | Reason |
|---|---|---|
| LT | Lead time | How long uncertainty must be covered? |
| σD | Standard deviation of demand | How volatile is demand? |
| Z | Service level factor (Z-score) | How much protection do the business want? |
Together, these three variables quantify uncertainty and determine how much inventory is required to protect service during the replenishment period.
An increase in any of these variables will increase the recommended safety stock level.
More advanced calculations also incorporate lead-time variability and/or supplier delivery risk, but the underlying principle remains the same.
Assume the following:
| Input | Value |
|---|---|
| Average weekly demand | 100 units |
| Demand standard deviation (weekly) | 20 units |
| Lead time | 4 weeks |
| Service level | 95% |
| Z factor | 1,65 |
The calculation becomes:
Safety Stock = 1.65 × 20 × √4
Safety Stock = 66 units
In this example, the business would hold approximately 66 units of safety stock to achieve a 95% service target based on the observed demand variability.
Of the three variables, service level is often the most misunderstood and misused.
Unlike demand variability and lead time, service level is not an operational reality. It is a management decision that determines how much inventory the business is willing to invest in protecting availability.
The service level is converted into a multiplier known as the Z-factor.
| Service Level | Z-Factor (service level multiplier) |
|---|---|
| 90% | 1.28 |
| 95% | 1.65 |
| 98% | 2.05 |
| 99% | 2.33 |
| 99.9% | 3.09 |
Many organizations assume that increasing service levels is a low-cost way to improve availability. In reality, small increases in service level can require disproportionately large increases in inventory investment, particularly once service targets move into the high-90s.
As service levels increase, the multiplier increases and so does safety stock.
Importantly, this relationship is not linear.
This is one reason many experienced organizations carefully calibrate system service levels rather than automatically matching customer service targets.
| Generally Well Suited For | Often Less Suited For |
|---|---|
| High-volume products | New products |
| Stable demand patterns | Highly intermittent demand |
| Reliable historical data | Limited demand history |
| Advanced planning system | Manual planning environments |
The statistical approach provides a structured and scalable way to calculate safety stock and is therefore widely used in ERP and planning systems.
By incorporating demand variability, lead time, and service level, it creates a consistent framework for balancing inventory investment against service risk.
However, like any model, the quality of the output depends on the quality of the inputs. Poor demand history, intermittent demand patterns, or changing business conditions can reduce the accuracy of the calculation.
In practice, many organizations therefore use the statistical result as a starting point and then adjust it based on business criticality, operational considerations, or inventory policies.
Coverage-based safety stock takes a different approach than statistical methods.
Rather than estimating future uncertainty from historical demand patterns, management explicitly decides how much replenishment risk the business wants to protect against.
The underlying question is simple: How much additional demand should we be able to cover if replenishment takes longer than expected?
In many organizations, the answer is expressed as a percentage of lead-time demand.
| Safety Stock Policy (examples) | Protection Provided |
|---|---|
| 50% of lead-time demand | Covers approximately half of an additional lead time |
| 100% of lead-time demand | Covers one additional lead time |
| 150% of lead-time demand | Covers one and a half additional lead times |

The calculation is straightforward:
Safety Stock = Average Demand × Lead Time × Coverage Percentage
(alternatively: Safety Stock = Average Daily Demand × Target Coverage in Days)
Unlike statistical methods, coverage-based safety stock does not attempt to quantify demand variability mathematically.
Instead, management explicitly defines how much additional demand or replenishment delay the business wants to be prepared for.
Increasing either the coverage period or the assumed demand level will increase the resulting safety stock requirement.
Assume the following:
| Input | Value |
|---|---|
| Average weekly demand | 100 units |
| Lead time | 4 weeks |
| Coverage policy | 50% of lead-time demand |
Step 1: Calculate lead-time demand
Lead-Time Demand = 100 × 4 = 400 units
Step 2: Calculate safety stock
Safety Stock = 400 × 50% = 200 units
In this example, the business chooses to hold inventory equivalent to 50% of lead-time demand, providing approximately two weeks of additional protection if replenishment is delayed.
Unlike statistical safety stock, the coverage-based approach does not attempt to quantify variability mathematically. Instead, it translates management’s risk tolerance directly into an inventory buffer.
This makes the method particularly attractive in situations where historical demand data is limited, unreliable, or simply less important than the consequences of a stock-out.
The method is also highly transparent. Most managers immediately understand what it means to hold inventory equivalent to 50% or 100% of lead-time demand. As a result, discussions focus less on statistical assumptions and more on business risk, supplier reliability, and inventory policy.
Coverage-based safety stock is commonly used for:
| Generally Well Suited For | Reason |
|---|---|
| Spare parts and maintenance inventory | Demand is often sporadic and difficult to model statistically |
| New products | Insufficient demand history exists for reliable statistical calculations |
| Low-volume or intermittent-demand items | Statistical calculations may be unstable, and the effort required to maintain them often outweighs the benefit |
| Strategic inventory | Business continuity may outweigh mathematical optimization |
| Long lead-time items | Management may prefer explicit protection against supply disruption |
The coverage-based approach is sometimes viewed as less sophisticated than statistical safety stock. In reality, it is simply solving a different problem.
Statistical methods attempt to estimate how much uncertainty is likely to occur. Coverage-based methods explicitly define how much uncertainty the business wants to be prepared for.
For this reason, many organizations use coverage-based policies not as a substitute for statistical methods, but as a deliberate inventory strategy for selected product groups.

Calculating safety stock is only the first step. In practice, many organizations adjust calculated safety stock levels to reflect business risks that are not fully captured by historical demand patterns or coverage policies.
In other words, the calculation may determine the starting point, but business risk often determines the final inventory decision.
Not all stock-outs have the same consequences.
A shortage of one component may cause only minor inconvenience. A shortage of another may stop production, damage customer relationships, or create a lengthy recovery process.
As a result, many organizations deliberately adjust safety stock levels based on factors such as:
| Risk Factor | Potential Impact |
|---|---|
| Long lead-time materials | Recovery from shortages may take months |
| Single-source components | Alternative supply options may not exist |
| Production-constraining items | Downtime costs can exceed inventory carrying costs |
| Strategic customer products | Service failures can damage key customer relationships |
| Regulatory or compliance items | Stock-outs can create legal or operational risks |
Unlike statistical or coverage-based calculations, these adjustments are not primarily driven by demand patterns. They are driven by the business consequences of a shortage.
The objective is not to optimize inventory mathematically. The objective is to ensure that inventory investment reflects actual business risk.
The greater the business impact of a stock-out, the more inventory the organization may choose to hold.
Consider two components used in the same production process. Both are important to production, yet the consequences of a stock-out are very different.
| Component A | Component B |
|---|---|
| Production-critical | Production-critical |
| 8-week replenishment lead-time | 2-week replenishment lead-time |
| Single-source supplier | Multiple qualified suppliers |
| Difficult to expedite | Easily expedited |
| Long recovery after stock-out | Short recovery after stock-out |
From a production perspective, both components are important.
However, the business risk is not the same.
A statistical model may recommend similar safety stock levels if demand patterns are comparable. A business-risk assessment, however, would likely lead to different inventory decisions.
The organization may choose to hold significantly more inventory of Component A because the consequences of a shortage are far greater, even though both components support the same production process.
One challenge when discussing inventory is that terms such as critical, strategic, or contractually required are often used as blanket explanations for high stock levels.
In many organizations, however, these items are not separately identified, measured, or tracked.
As a result, criticality can become a convenient explanation that masks other drivers of inventory such as long lead times, poor forecast accuracy, excessive batch sizes, or outdated planning parameters.
If an item is truly critical, the business should be able to identify it, quantify it, and explain exactly why it requires additional inventory.

A common misconception is that organizations should apply the same safety stock methodology across all inventory.
In practice, this rarely makes sense.
Different products exhibit different demand patterns, supply risks, business importance, and planning requirements. Applying the same safety stock logic to every SKU often results in unnecessary complexity for some products and insufficient protection for others.
As a result, many organizations segment their inventory and apply different safety stock approaches depending on the characteristics of the item.

ABC-XYZ segmentation is one of the most common frameworks used to differentiate inventory policies.
The model combines two dimensions:
| Dimension | What is Measures |
|---|---|
| ABC | Business importance, inventory value, or consumption |
| XYZ | Demand predictability and variability |
This creates a practical framework for determining not only how much inventory to hold, but also how sophisticated the safety stock approach should be.
| X - Stable Demand | Y - Moderate Variability | Z - High Variability | |
|---|---|---|---|
| A - High Value / Importance | Statistical safety stock Focus on accuracy and optimization | Statistical safety stock with regular review | Statistical safety stock combined with business-risk assessment |
| B - Medium Value / Importance | Statistical or coverage-based approach | Statistical or coverage-based approach | Coverage-based safety stock with selective review |
| C - Low Value / Importance | Simple coverage policy | Coverage-based safety stock | Coverage-based safety stock or management judgement |
The objective is not to apply the most sophisticated method to every item. The objective is to apply the most appropriate method.
AX items are often the best candidates for statistical safety stock. Demand is relatively predictable, inventory investment is significant, and even small improvements can create meaningful working capital benefits.
AZ items are often the most challenging to manage. They combine high business importance with high demand variability. Statistical calculations can provide a useful starting point, but many organizations supplement them with business-risk assessments and regular review.
CZ items represent the opposite situation. Demand is often sporadic, inventory value is relatively low, and the effort required to maintain sophisticated statistical models frequently outweighs the benefit. Simpler coverage-based policies are often more practical.
Very few organizations rely exclusively on a single safety stock methodology.
Instead, statistical calculations, coverage-based policies, and business-risk assessments are often used together as part of a broader inventory management framework.
A fast-moving product with years of demand history may justify sophisticated statistical modelling. A slow-moving spare part may be better managed through a simple coverage rule. A single-source component with a long lead time may require additional protection regardless of what the statistical calculation suggests.
The most mature inventory organizations do not manage safety stock through a single formula. They combine different approaches to reflect the characteristics, risks, and business requirements of different inventory segments.


Become a certified working capital expert and learn how to apply these principles in practice with the Managing Working Capital course.
