Accounts Receivable (AR) is far more than “money owed by customers.” It represents the cash tied up in sales that has been made but not yet paid for. AR reflects customer credit policies, collection discipline, and the efficiency of the entire Order-to-Cash (O2C) cycle.
Managed well, AR accelerates inflows, strengthens customer relationships, and fuels growth without relying on external financing. Managed poorly, it creates cash flow strain, increases financing costs, and introduces credit risk that can destabilize profitability.
This guide provides a comprehensive overview of Accounts Receivable: from the basics of what AR is, to process design, key metrics, collections management, financing options, and advanced insights from transactional data analysis.
Want to download this article for free?
Create a free account on My Academy Hub to download the article Accounts Receivable: Complete Guide, Metrics & Best Practices today.
Become a Certified Working Capital Expert with our accredited course Managing Working Capital
Accounts Receivable (AR) refers to the money customers owe a business for goods or services delivered on credit. It is recorded as a current asset on the balance sheet, typically collectible within 30–90 days.
At its core, AR reflects a trade-off: companies extend credit to boost sales and strengthen customer relationships, but this ties up cash until customers pay.
A company’s AR position is a direct function of the credit terms it grants, the enforcement of those terms, and customer payment behaviour.
Typical AR obligations include:
Recurring subscription invoices (telecom, SaaS, utilities).
Why it matters:
Credit terms define the timing and conditions under which a customer must settle an invoice after receiving goods or services. They are more than administrative details on a contract: they sit at the intersection of sales competitiveness, customer relationships, and liquidity management.
The terms a business offers reflect its market position, bargaining power, and risk appetite. Liberal terms can stimulate sales and strengthen customer loyalty, but they also tie up cash and increase credit risk. Strict terms preserve liquidity but may make a company less attractive compared to competitors.
| Term Type | Trigger Date | Typical Use Case | Impact on Cash Flow |
|---|---|---|---|
| Advance Payment | Before delivery | Made-to-order goods, custom manufacturing, upfront services | Protects supplier; increases buyer’s upfront cash need |
| Cash on Delivery (COD) | At delivery / receipt of goods | New customers, high-risk buyers | Supplier gets cash immediately; no credit period for buyer |
| Net Days (e.g., Net 30/60/90) | Fixed days after invoice date | Standard across industries; larger buyers push for longer terms | Extends buyer liquidity; delays supplier inflows |
| End of Month (EOM) | End of the invoice month | Synchronizes with monthly closing cycles | Predictable for both parties; may shorten/lengthen cash cycle depending on issue date |
| Early Payment Discounts (e.g., 2/10 Net 30) | Within discount window (e.g., 10 days) | Suppliers use to speed up cash collection; buyers weigh benefit if discount % exceeds their cost of capital | Buyer reduces cost if discount > cost of capital; reduces liquidity sooner |
| Milestone Terms | Payments are linked to progress markers (e.g., 20% upfront, 40% at project midpoint, 40% at completion) | Common in project-based industries such as construction, consulting, or IT. | Balances seller risk by ensuring partial cash inflows throughout long projects. |
The original purpose of payment terms is to balance cash flows between buyers and suppliers:
While AP tracks what a business owes suppliers, Accounts Receivable (AR) tracks what customers owe the business:
| Accounts Payable (AP) | Accounts Receivable (AR) |
|---|---|
| Money owed to suppliers | Money owed by customers |
| Classified as a current liability on the balance sheet | Classified as a current asset on the balance sheet |
| Represents a supplier credit obligation | Represents customer credit sales |
| Positive impact on working capital - delays cash outflows and conserves liquidity | Negative impact on working capital - ties up cash until customers pay |
Together with Inventory, AP and AR form the backbone of working capital dynamics.
For AR, payment terms are not just an administrative line on an invoice – they are a strategic lever that directly influences cash inflow, operating working capital, and credit risk.
In other words, AR management is the balance between supporting customers and protecting your own liquidity. Companies that thrive are those that use credit terms responsibly: enabling sales and relationships without undermining cash flow discipline.
In AR, payment terms are rarely set unilaterally by the seller. Customers – especially large or strategically important ones – often exert significant bargaining power to secure longer terms. This creates a tension: granting extended credit may be necessary to win or keep business, but it also shifts financing costs and liquidity risk onto the seller.
How AR managers can respond:
The Balancing Act
The most resilient companies find a middle ground:
In short: AR management is not about refusing long terms outright but about managing the consequences strategically.
Payment terms are not just commercial agreements; in many jurisdictions, they are also shaped by law. Regulators worldwide have recognized that imbalances in bargaining power – where large buyers can pressure smaller suppliers into long or unfair terms – distort liquidity across supply chains. To address this, governments have introduced rules that cap maximum terms or impose penalties for late payments.
From an Accounts Receivable perspective, this means businesses must design credit policies that are not only competitive and customer-friendly but also compliant with local legal frameworks. Sellers cannot always extend unlimited credit, even if commercially attractive, because doing so may breach statutory limits or expose them to legal penalties for “unfair” terms.
Examples of regulatory frameworks:
For detailed legal and regulatory differences by country, see this country-by-country payment terms overview from Taulia.
The Takeaway
While legal frameworks are primarily designed to protect smaller suppliers, they have direct implications for AR management. Companies must ensure that the credit terms they offer:
In short: AR policies must be designed globally but enforced locally. Sellers need to respect both regulatory frameworks and cultural norms while safeguarding liquidity and customer relationships.

Extending credit is both a commercial choice and a risk decision. Every receivable is effectively a short-term loan to a customer – and like any loan, it carries the possibility of late payment or default.
Strong AR performance therefore depends on who you extend credit to, how much exposure you take, and how you monitor risk over time.
Bottom line: Credit risk management ensures AR is a reliable asset, not a hidden liability. A disciplined framework protects liquidity, stabilizes profit quality, and enables growth without exposing the company to uncontrolled default risk.

Accounts Receivable is often misunderstood. It is not revenue – revenue is recognized when goods or services are delivered and earned, while AR represents the unpaid portion of that revenue. Until the customer settles the invoice, AR sits on the balance sheet as an operating current asset, signaling a claim to future cash.
In practice, AR connects the income statement and the balance sheet. Sales create revenue (P&L effect) and receivables (balance sheet effect). Only when customers pay does AR convert into cash.
Day 1: Sale on Credit
Day 30: Collection of Payment
This timing gap explains why profitable companies can still run into liquidity problems. If revenue grows quickly but customers are slow to pay, AR builds up, starving the business of cash even as profits look strong on paper.
In essence, AR quality matters as much as AR volume. A $1 million receivable from a reliable customer due in 30 days is very different from a $1 million receivable overdue by 90 days with a high risk of default. Both are “assets” on the balance sheet, but their real economic value differs dramatically.
Example: If AR rises by $100,000 in a quarter, that means more sales were made on credit than collected in cash – reducing operating cash flow by the same amount.
Like Accounts Payable, the balance of Accounts Receivable tells a story – but the interpretation is different. AP reflects financing received from suppliers, while AR reflects financing granted to customers.
Discipline is key:
The Takeaway
AR is not just a number in “operating current assets.” It is a timing bridge between sales and cash, and a reflection of how effectively a company converts reported profits into usable liquidity. Businesses that fail to monitor AR risk overestimating profitability and underestimating financing needs.

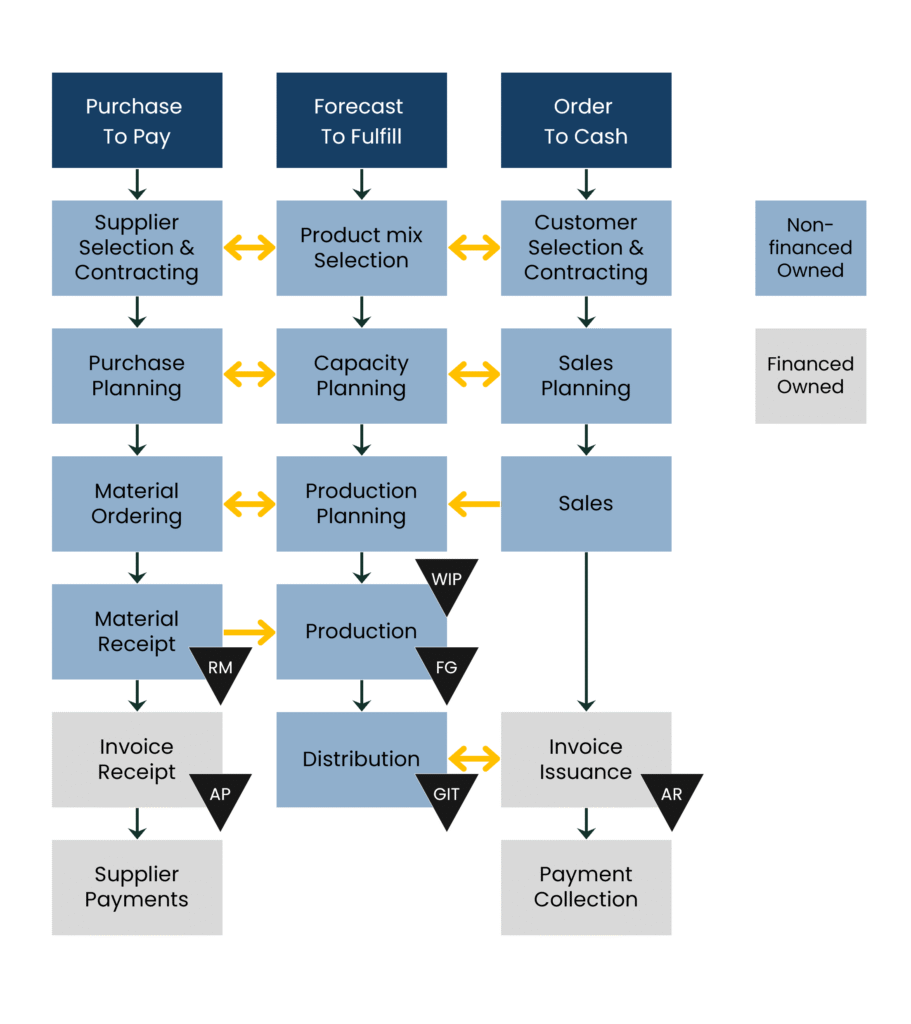
The Order-to-Cash (O2C) cycle is the operational backbone that generates and manages Accounts Receivable. It covers every step from the moment a customer is assessed for credit to the point where cash is collected and applied.
How well this cycle is designed and executed determines whether AR becomes a healthy source of liquidity or a bottleneck of disputes, delays, and defaults. In other words, AR on the balance sheet is not just an accounting figure – it is the direct outcome of O2C performance.
Despite its importance, the O2C process is often fragmented and under-optimized. Typical challenges include:
Like P2P in AP, O2C cannot be managed in isolation. It is tightly linked to other business processes:
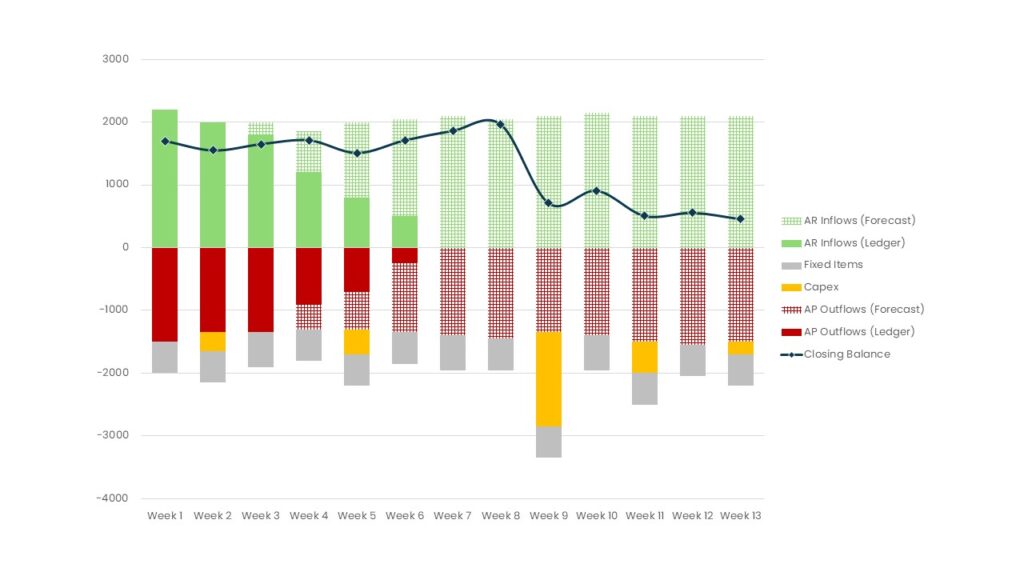
Example: A company celebrates record sales with Net 60 terms, but fulfillment bottlenecks delay invoicing by two weeks. On paper, revenue looks strong; in reality, cash inflows are delayed by 75+ days, forcing the company to borrow externally.
When the O2C cycle breaks down, the effects rarely appear immediately on the income statement. Revenue is booked, profits look healthy, but the hidden costs emerge later in operating working capital strain, financing expenses, and weakened customer relationships.
Typical hidden costs include:
Why This Matters
On the surface, O2C failures often masquerade as “just delays.” In reality, they:
The takeaway: Healthy AR is not just about recording invoices – it’s about disciplined, transparent, and proactive management of the O2C cycle. Companies that ignore these hidden costs end up paying for them in liquidity strain, financing dependence, and diminishing customer trust.

Collections discipline is at the heart of Accounts Receivable performance. Even with well-designed credit terms and accurate invoicing, cash only flows when customers actually pay. Effective collections ensure that credit sales translate into liquidity, while weak collections create silent leaks in operating working capital.
Why Collections Matter
Collection is not just about “chasing late payments.” It is a strategic capability that:
Companies that excel in collections combine automation, human judgment, and process learning. They act early, communicate consistently, and turn disputes into continuous improvement opportunities.

Measuring AR performance is essential, but not always straightforward. Traditional accounting ratios give a high-level picture, while transactional data analysis reveals the real story of how effectively receivables are managed.
Traditionally, two accounting metrics are used to assess how a company manages its receivables: the Accounts Receivable Turnover Ratio (ART) and Days Sales Outstanding (DSO).
The Accounts Receivable Turnover ratio (ART) shows how many times per year a company collects its average receivables:
AR Turnover Ratio = Net Credit Sales / (Average) AR
Days Sales Outstanding (DSO) expresses the same relationship in terms of days:
DSO = (Average) AR / Net Credit Sales × 365
Example: A DSO of 55 means the company, on average, is paid by its customers 55 days after sales.
Unlike the turnover ratio, this measure is directly comparable to contractual customer payment terms, industry benchmarks, and regulatory limits. For this reason, most practitioners focus on DSO rather than ART.
DSO is also one of the three core levers of the Cash Conversion Cycle (CCC), alongside Days Inventory Outstanding (DIO) and Days Payable Outstanding. Together, these metrics show how effectively a company converts its operating capital into cash.
For a full breakdown, see our separate guide to the cash conversion cycle here:
Both ART and DSO aim to measure how efficiently receivables are collected, but in practice DSO is far more useful for managers than ART.
Why DSO is better than ART:
That said, both metrics share the same flaw: they are balance sheet averages and can mask late payments, posting delays, or overgenerous terms. That’s why transaction-level analysis is essential to get beyond headline ratios.
Traditional AR metrics like Days Sales Outstanding (DSO) and the AR Turnover Ratio are useful at a high level, but they often mislead.
To get a true picture of AR performance, companies must combine transaction-level metrics with aging reports. This reveals how invoices are actually handled, not just how balances appear at month-end.
Key transactional metrics include:
Aging reports add another layer of insight:
This granularity moves AR management from “average performance” to targeted action: focusing on high-risk accounts, resolving disputes, and renegotiating terms with chronic offenders.
Critical Perspective
DSO may tell you “on average” collections look fine – but averages conceal reality. A deeper look often reveals:
The takeaway:
Use DSO as the headline measure but always supplement it with transaction-level metrics and ageing analysis to uncover late payment patterns and habitual offenders.
Companies that rely solely on balance sheet KPIs risk managing by illusion rather than reality.
For a step-by-step walkthrough of how to structure and run an Accounts Receivables Transaction Data – including the data needed and how to calculate these metrics – see our Masterclass: a step-by-step guide to AR Transaction Data Analysis.
A mid-sized industrial supplier reported stable Days Sales Outstanding (DSO) of ~42 days. On the surface, it appeared disciplined: inflows matched the company’s Net 45 policy, cash flow seemed predictable, and management believed receivables were under control.
But a transaction-level analysis revealed a very different picture:
Weighted average masked risk: While the headline DSO was 42 days, the true weighted average (by customer and invoice) showed major distortions. Some large customers routinely paid at 55–60 days, while smaller accounts settled in 20–25 days. The early payers masked chronic lateness at the top end.
Policy erosion: Sales teams had quietly extended more generous terms to strategic accounts to secure volume, bypassing credit policy. These were not visible in aggregated metrics.
Posting delays: Invoicing often lagged delivery by 7–10 days. On paper, receivables looked on time — but in reality, cash inflows lagged well beyond reported DSO.
Dispute-driven slippage: A growing portion of receivables sat in “pending” status due to preventable errors (missing PO numbers, price mismatches). These invoices were not classified as overdue, yet they locked up millions in cash.
Lesson
Headline KPIs like DSO created a false sense of stability. The averages hid weak enforcement of credit terms, tactical sales concessions, and systemic invoicing errors that delayed actual inflows.
Takeaway
Accounts Receivable must be managed with transaction-level visibility and discipline. While metrics like DSO are useful, only aging analysis, dispute tracking, and customer-level payment behavior reveal the true health of collections. AR is not just an accounting line — it is a live test of credit policy, sales alignment, and O2C discipline.
AR is not just about issuing invoices and waiting for payment – it is about aligning credit policy, operational discipline, and customer management with business strategy.
When strategic priorities demand liquidity faster than customers pay, AR can be converted into cash through financing. These tools provide flexibility but must be weighed against cost, complexity, and customer impact.
Strategic trade-offs:
In short: receivables financing is a powerful tool – but it should be part of a broader AR strategy, not a substitute for strong collections discipline.

Accounts Receivable is transforming from a manual back-office task into a predictive, data-driven, and strategically integrated function.
Key trends shaping the future:

Accounts Receivable is not simply “waiting to be paid.” It is:
Companies that elevate AR from routine invoicing to data-driven, strategic management unlock:

AR is a current asset — not revenue. Revenue is recognized when earned, while AR represents the unpaid portion of that revenue still owed by customers.
DSO measures AR in days, directly comparable to terms and industry benchmarks. ART (“turns per year”) is abstract and less intuitive for managers.
Aging reports classify receivables by due date buckets (current, 30, 60, 90+). They identify overdue balances, habitual late payers, and emerging credit risk.
Even profitable firms can face cash shortages if collections lag.
It’s the risk customers won’t pay on time — or at all. Managed via credit policies, limits, monitoring, and provisioning for doubtful accounts.
Factoring, invoice discounting, securitization, and supply chain receivables platforms. These convert AR into cash but come at a cost.
Because sales don’t matter until they turn into cash. Collections ensure credit sales translate into liquidity and protect customer relationships by resolving disputes quickly.
Turn theory into practice and boost your career with accredited training. Become a Certified Working Capital Expert by enrolling in our flagship course: Managing Working Capital.
Check out all Working Capital Hub Insights here